
4D v16.3
Adding calculations
 Adding calculations
You can add summary calculations on the contents of fields and formulas to each Subtotal row and to the Totals row. When you place a summary calculation in the Totals row, the calculation is done for all records in the report. If you place the summary calculation in a subtotal row, separate calculations are done for the records in each break.
The summary calculation options available for quick reports are found in the pop-up window for a total or subtotal row:
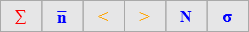
These calculations are also available in the menu that appears when you double-click a cell in a total or subtotal row:
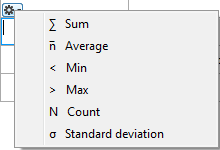
- Sum: Totals the values in the report or break.
- Average: Calculates the average of the values in the report or break.
- Minimum: Displays the lowest value in the report or break.
- Maximum: Displays the highest value in the report or break.
- Count: Calculates the number of records in the report or break.
- Standard deviation: Displays the square root of the variance of the report or break (the variance is a dispersion value around the average).
The Sum, Minimum, Maximum and Average calculations work only on a numeric field or formula.
4D displays a calculation icon in the selected cell for each type of summary calculation you request (when no label is added). You can place several calculations in the same cell; they will be stacked in the report generated. The following figure shows the Sum, Average and Min icons in a subtotal row:

Note that if you insert text labels in the cell, the calculations appear as codes (see below). If you add several calculations, you can format the cell, add commas, carriage returns, and so on.
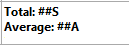
You can insert summary calculations using the following codes:
- ##S will be replaced by the sum in the Subtotal or Total row.
- ##A will be replaced by the average.
- ##C will be replaced by the count.
- ##X will be replaced by the max.
- ##N will be replaced by the min.
- ##D will be replaced by the standard deviation.
- ##xx, where xx is a column number. This will be replaced by that column’s value, using its formatting. If this column does not exist, then it will not be replaced.
These codes can be useful when you want to mix labels and data in a cell.
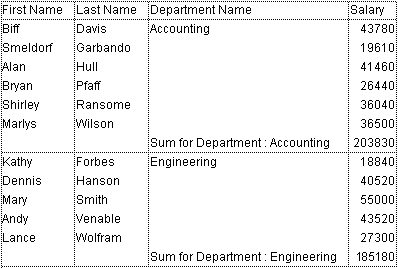
In a report with subtotals, the columns which are used to group records so that summary calculations can be done are called Break columns. In the report shown below, the Department field is a Break column since the records in the report are grouped by department.
When a report like this is printed, the values for the Break column are printed only once per break.
In other words, a department name is printed only for the first record in the group and is not repeated until the department changes.
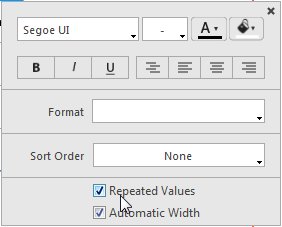
In some cases, you may want to repeat the values for the Break columns so that they appear for every record in the Break area. You do so by selecting the Repeated Values column property. This property is set in the pop-up window associated with the column header:
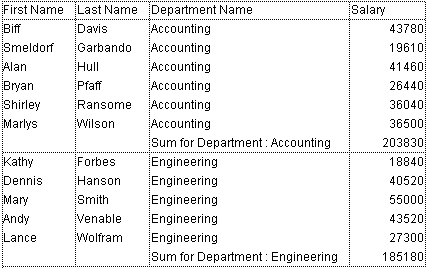
When the report is printed, break column values are repeated for each record.
The following figure shows the previous report after the Repeated Values check box has been checked for the Department Name column:

Product: 4D
Theme: Quick reports (64-bit)
4D Design Reference ( 4D v16)
4D Design Reference ( 4D v16.1)
4D Design Reference ( 4D v16.3)


