
4D v16.3
Sorting report records
 Sorting report records
An important feature of the Quick Report editor is the ability to sort the records in your report. You sort records for two reasons:
- To view records in a particular order,
- To create groups of records and subtotal areas in the report for the purpose of reporting summary calculations for groups.
You can specify a sort order at any time; simply drag and drop a column into the Sort order list. For example, if you wanted to sort the records of salespeople by the Sales Region field, you would drag and drop the Sales Region column into the Sort order area.
You can also sort based on a formula by selecting the column that contains the formula and placing it in the Sort order list. For more information about adding formulas to quick reports, refer to Associating formulas with a quick report.
You can sort a report on several levels. The order in which the fields and formulas appear in the Sort order list indicates the sort level.
To specify the sort order using the field list:
- Drag the Field you want to set as the sort level from the Fields list to the Sort order list.
OR
Highlight the field from the Field lists and click on the field insertion button .
.
The field is then added to the Sort order list:
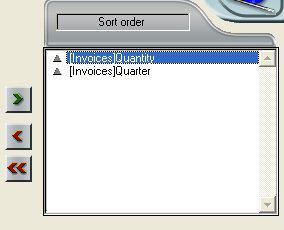
By default, sorts are carried out in increasing order (A -> Z). You can reverse the direction of the sort by clicking on the triangle next to the field in the Sort order list.
Note: If the sorted field has not already been inserted into a report column, an additional column is automatically created in the Quick Report area.
To specify a sort for a column (field or formula):
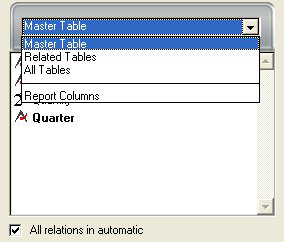
- Select Report Columns from the table selection drop-down list.
The list then displays the headers of the columns present in the report: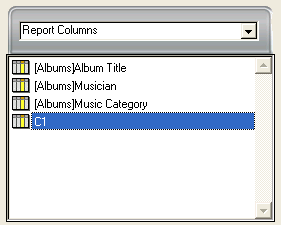
- Drag the column that you want to set as the sort level and drop it in the “Sort order” list.
OR
Highlight the field from the Field lists and click on the field insertion button.
4D then displays the name of the column in the Sort order list.
To change the level of a sort:
- Right-click on the field in the Sort order list in order to display the context menu.
- Select Up or Down to move the field up or down (respectively) in the sort levels.
You can delete any field or formula from the Sort list.
To remove a field or formula from the Sort order:
- Select the field or formula to be deleted in the sort list and display the context menu using a right-click.
- Select Delete.
The level is then removed. Note that the associated column is not removed from the report. On the other hand, the associated subtotal row disappears.
In a Cross-table report, the only values that can be sorted are the horizontal and vertical data sources (the two data sources that are used as categories in the final table).
To sort the categories in a cross-table report, click the sort indicators in the Sort order area. An arrow indicates the sort order specified:
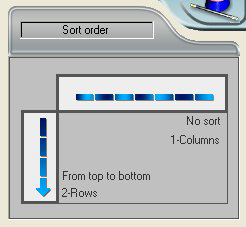
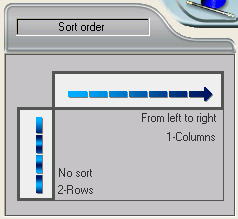
To modify or delete the sort order of a data source, click on it again. The different possible reports appear successively. When no arrow is displayed, no sort order is selected. In this case, values will be displayed in the order they appear in the selection.
In a quick report, you set break levels to separate or “break” records into groups according to values in one or more sort fields. A break area is printed at each break level. You can print summary calculations in the break area. The summary calculations — sum, average, minimum, maximum, count and standard deviation — are calculated for each group of records.
Break levels are determined by the sort levels and Break rows. For example, if you sort records by Sales Region, 4D inserts a break between each group of records that have the same sales region. These rows are automatically inserted when a sort is defined.
After you add a subtotal row to the quick report, you can request summary calculations on each break. For example, you can insert a summary calculation in a subtotal row to display subtotals for sales from each state in a marketing region. For more information about adding summary calculations to Subtotal and Total rows, refer to Adding summary calculations.

The label of a subtotal row indicates which change in value triggers the break.
You can improve the appearance and clarity of your reports by labeling each Subtotal row using the value of the Break field.
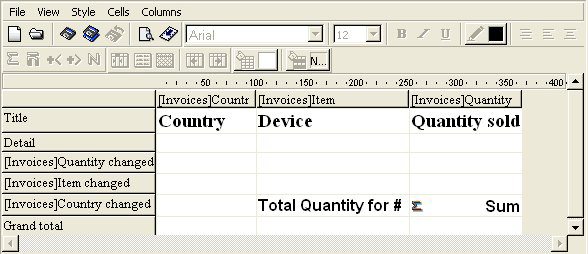
To request that the value of a Break field be printed in a label placed in the Break area, use the number sign (#) in the label. For example, the text “Total salaries for # department” will insert the department name (in this case, the value of the Department field) in place of the number sign when the report is printed.
The number sign does not need to be placed in the same column as the Break field. It will display the value of the Break field in any cell in the Subtotal row.
The following figure illustrates the use of the number sign in a label in the Subtotal row:
You can configure subtotal rows in order to control the page layout and appearance of the quick report. For example, you can generate a page break after each subtotal.
The subtotal page layout options can be used to visually set apart the different parts of the report.
To set the spacing for a subtotal row:
- Select a subtotal row and choose the Totals Spacing command from the File menu of the editor.
OR
Right-click on the subtotal row title and choose the Totals Spacing command.
The “Subtotals Properties” dialog box appears: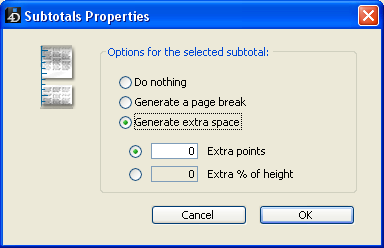
- Choose one of the three following options:
- Do nothing (option selected by default): No specific property is applied to the subtotal row; it has the same spacing characteristics as the other rows of the report.
- Generate a page break: A page break is generated after each subtotal row in the report.
- Generate extra space: A specific amount of space is added below each subtotal row in the report.
An additional option can be used to set the spacing mode:- Extra points: You set a specific height of extra space in points.
- Extra % of height: You set the amount of extra space to be added as a percentage of the standard row height of the report. For example, to generate extra space corresponding to two empty rows, pass the value 200.

Product: 4D
Theme: Quick reports
4D Design Reference ( 4D v16)
4D Design Reference ( 4D v16.1)
4D Design Reference ( 4D v16.3)


