
4D v16.3
Introduction
 Introduction
One of the most important tasks in data management is report generation. The Quick Report editor is one of two tools made available by 4D for the purpose of designing reports. You use the Quick Report editor to create ad-hoc reports in the Design and Application environments.
The other tool is the Form editor, which you can use to design reports in the Design environment (which can be altered subsequently in Application mode). You should use an output form to design reports that require complex designs or programmatic processing. This possibility is detailed in the Output forms and reports chapter.
Using the Quick Report editor, you can:
- Produce lists of records
- Create break areas
- Produce cross-table reports
- Compute summary calculations
- Modify fonts and styles in the report
- Define borders and background colors on a cell basis
- Save and open quick report designs to disk
- Select different output types such as HTML or text file, 4D View area, printing or saving to disk.
The Quick Report editor can be managed by programming using the commands of the Quick Report theme.
The Quick Report editor consists of two main areas:
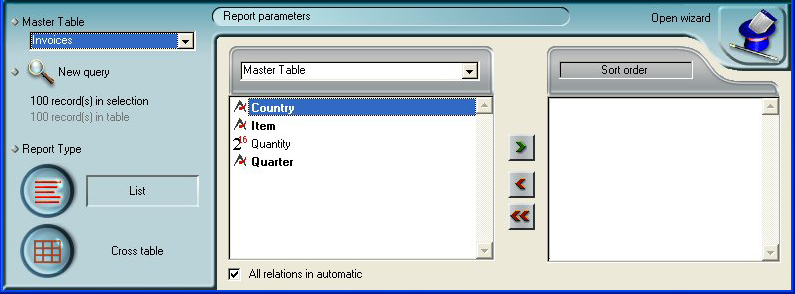
The data area that is used to specify the type of report to be built and the data to be integrated; it also can be used to access the Quick Report Wizard:
The actual Quick Report area:
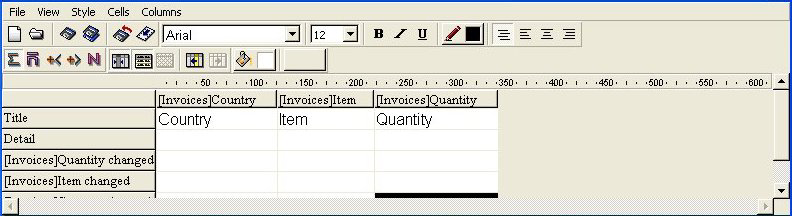
This shows the area as it appears when a Quick Report area is inserted in a form. This is where actual column and row contents are created, where sort orders are defined, etc. Also, this area includes various toolbars, its own menu bar and context menus.
For example, this area could be placed in a form as depicted below:
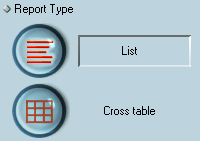
In the Quick Report editor there are two operation modes available which generate two specific types of reports: List and Cross table.
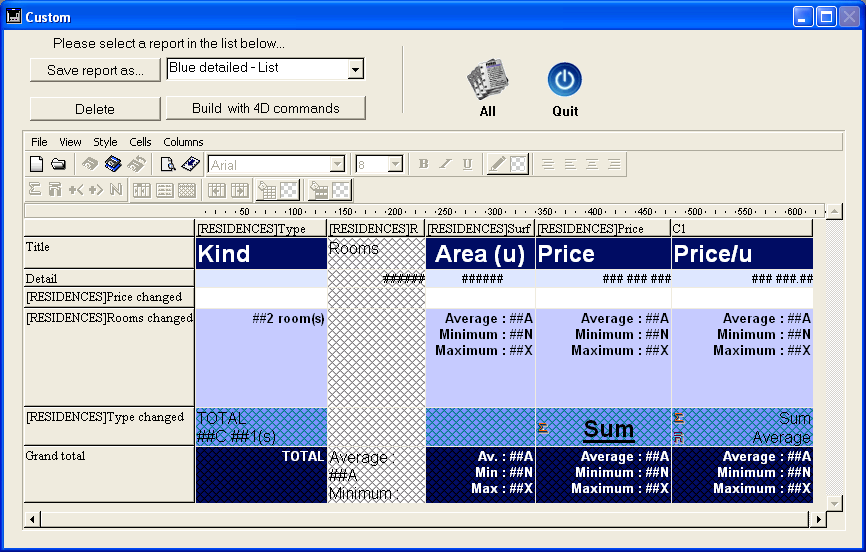
- List mode
This is the default mode. In this mode, reports would typically display records as a list with break levels where sums would be performed. The following is a typical List quick report: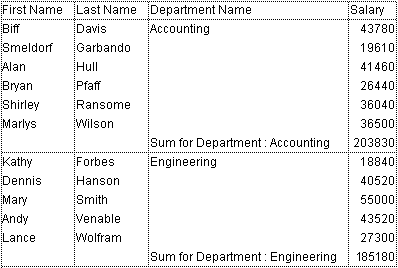
- Cross-table mode
This mode allows you to display your report as a two-dimensional table. This is useful when you want to display data from a data source broken down into categories that are actually a function of two other data sources.
For example, a cross-table form would let you display in a table how many of each product type was sold in each quarter. The following is a typical Cross-table Quick Report: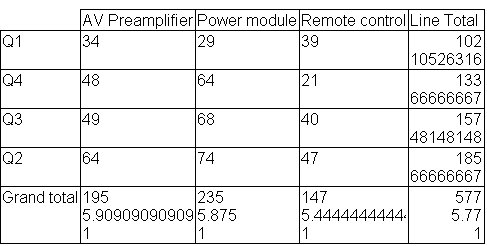
When creating a manual Quick report, you can use the Wizard to guide you through the creation of the report.
To start the wizard, click the Open wizard button in the Quick Report editor:

The pages of the wizard then replace the data area in the window of the Quick Report editor. The construction of the report is then carried out through detailed steps with comments appearing in the right-hand part of the window. To create a Quick Report using the wizard, follow the instructions displayed on the screen.
When you have finished constructing the report, the wizard offers you the possibility of generating the corresponding 4D code. For more information about this, refer to Generating 4D code.
To exit the wizard, click on the button to return to Manual mode:

Product: 4D
Theme: Quick reports
4D Design Reference ( 4D v16)
4D Design Reference ( 4D v16.1)
4D Design Reference ( 4D v16.3)


