
4D v16.3
Graphic attributes of a report
 Graphic attributes of a report
You can modify the graphic appearance of a quick report. The Quick Report editor lets you set the following attributes:
- the character font, as well as its size, justification, style and color,
- the background color of the cells,
- the cell borders.
In addition, 4D provides a set of predefined report templates that you can modify as desired.
Note: Appearance specifications are only taken into account for the “Printer” and “HTML File” output destinations (colors). With other types of output, the formatting of reports must be carried out after the report is generated, using the target applications (4D View or a text editor). For more information about report destinations, refer to Executing a quick report.
While designing your quick report, you can specify different fonts, font sizes, justification, styles and colors. You can then apply these specifications to text, data, and summary calculations within rows, columns, or cells in the quick report.
If you assign specifications to the Detail row of the report, you will not see the results until you preview or print the report.
You can specify font attributes using either the Quick Report menu commands or the Quick Report context menu.
To specify a character font, font size, style, justification or color:
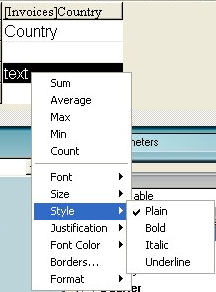
- Right-click on the row label, column header, or cell to which you want to apply the font attributes.
- In the context menu, use the Font, Size, Style, Justification or Font Color submenus to change the font attributes as desired:
- In the report, select the column, row or cell that you want to configure.
- Choose a font in the drop-down font list and a size in the drop-down size list; then choose a style, justification and color in the Style toolbar:

Note: You can also assign a style and justification using the Style menu.
4D applies the parameters to the text, data or calculations included in the selected area.
The Quick Report editor allows you to set a background color for each cell. You can set either a single color or two alternating colors, which provides better readability for tables.
You can set background colors for both List and Cross-table reports. Background colors are used with the “Print” and “HTML File” output destinations.
To set a background color:
- Select a cell, column or row, then choose the main color in the “Background Color” palette of the toolbar:

You can assign any color combination that you want to the rows, cells and columns. - (Optional) If you want to use an alternating background color, choose it using the “Alt. Background Color” palette:

The cells which have been assigned two alternating background colors will display both of them in the Quick Report editor.
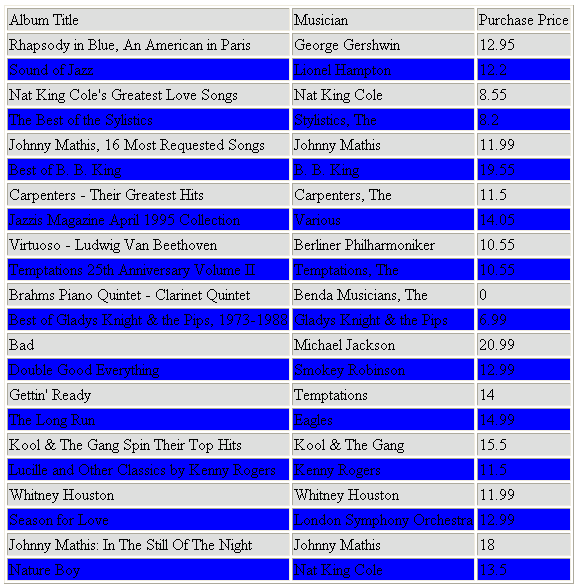
Here is an example of a generated report in List mode (preview) that has alternating background colors: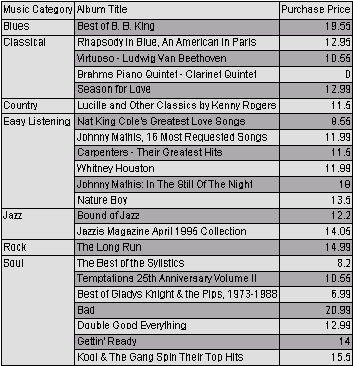
Background colors are also taken into account in reports generated in HTML format: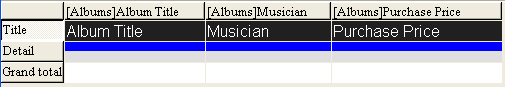
You can set the borders for cells in both cross-table and list reports.
To set the borders for a cell, a column or a row:
- Highlight a cell, column or row, and either select Borders... in the context menu or from the Style menu.
The “Borders” dialog box is displayed: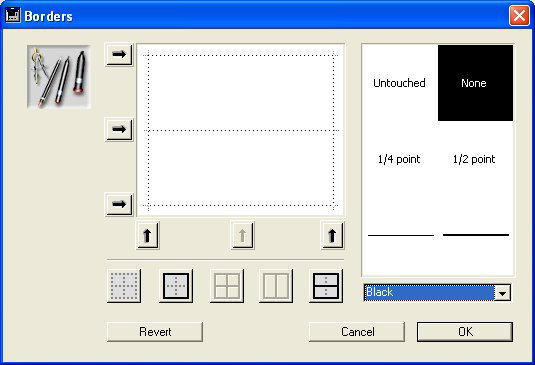
The preview area varies dynamically depending on the type of the selection: cell, column or row, but also whether a cell is in a list or cross-table type report. For example, the behavior of the center cell in a cross-table report is different from the behavior of a detail cell in a list report. The center cell is repeated both horizontally and vertically for a cross-table report, whereas the detail cell in a list report is going to be repeated only vertically. Also, other cells may not be repeated at all (titles, for instance).- If the selected cell is a title cell (which is not repeated), the outer lines represent the outer lines of the cell:

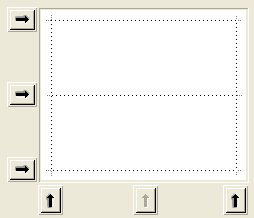
- If the selected cell is a detail cell in a List report (which is repeated vertically), the outer lines represent the outer lines of the cell repetition, and the inner horizontal line represents the border between two cells in the sequence:
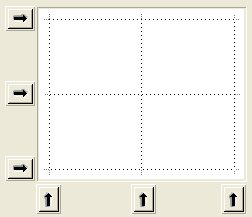
- If the selected cell is the center cell in a cross-table report (which is therefore repeated both horizontally and vertically), the outer lines represent the outer lines of the repetition of cells, and the inner lines represent the borders between each cell generated from the center cell:
- If the selected cell is a title cell (which is not repeated), the outer lines represent the outer lines of the cell:
- Select the line thickness and color to use.
You can use different colors for different borders. - Select the borders using either the arrows or the shortcut buttons.
You will notice that some shortcut buttons are disabled to match the type of the cell you are editing. - Repeat steps 2 and 3 for each border to be configured and then validate the changes.
You can use the Revert button to restore to the original border settings.
The Quick Report editor contains a set of predefined templates providing various graphic approaches for the production of printed or HTML reports. You can use all of the template as is or you can use it as a basis for constructing your own reports. A template can be applied at any time.
A report template combines a set of graphic characters: font, colors, style, borders and justification. You can use either all or part of the template characteristics.
To use a predefined template:
- Choose the Presentation... command in the Style menu.
The template selection dialog box appears: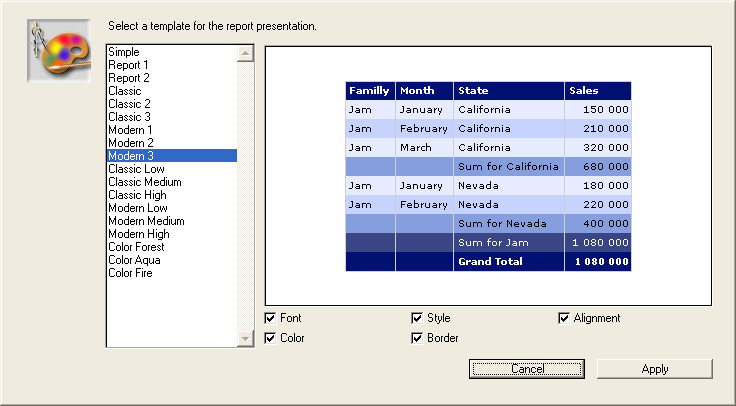
- In the list of predefined templates, click on the one that you want to use.
You can preview each template in the right-hand area of the dialog box. Choose the template that best corresponds to your needs, keeping in mind that you can always modify your report subsequently. - If you do not want to use all the graphic options set by the template, you can uncheck each option that you do not want to be taken into account.
By default, all the options are selected. If, for example, you uncheck the “Border” option, the borders defined by the template will not be applied to your report.
Note: Only the “Color” option will be taken into account for reports whose output destination is an HTML file. - Click on Apply.
The selected characteristics are immediately applied to your report. If any graphic attributes were set previously, they will be replaced. Keep in mind that certain characteristics will be only visible once the report has been generated.

Product: 4D
Theme: Quick reports
4D Design Reference ( 4D v16)
4D Design Reference ( 4D v16.1)
4D Design Reference ( 4D v16.3)


