
4D v16.3
Forms for printed reports
 Forms for printed reports
In 4D, you can produce a report using either a form or using the Quick report editor (see Quick reports).
There are several advantages to using a form for a report: you can use graphic elements on the form, you can control the placement of report elements precisely, you can use methods to perform calculations, and you can use headers to identify each subsection of a break report. Form reports can also be customized by each user with the help of the user form editor (see User forms).
You can use a form to create reports that:
- Require a non-columnar format,
- Display subforms,
- Contain embedded graphics,
- Require special graphic elements, such as hairlines.
Printed reports, unlike screen display forms, can make use of the Break area at the end of the report. For material that appears at the bottom of each page, printed reports use the Footer area.
Note: Selection type List boxes are also particularly suitable for displaying and printing lists of records.
Lists that display columns of information are common in printed reports. You might publish lists of telephone numbers, prices, results, specifications, or parts.
When you create a columnar report using the Form Wizard, you choose List Form for Printing as the Form Type.
Like the lists you design to display records on the screen, a printed list presents columns of information, can include column headings above each column, and can use graphic elements to enhance or clarify the report. The Break area, which is printed once at the end of the report, is used for calculating totals.
For a discussion of using methods for calculating totals, see the section “An example report” below.
You may need to print one record per page. For example, you may want to use an invoicing database to print a copy of each invoice for your records. You can also print a mail merge where only certain fields are modified for each page (see Creating mail-merge documents).
When you need to create such a report, you choose Detail Form for Printing as the Form Type in the Form Wizard.
Place the Header (H) control line at the top of the page and arrange the fields and other report elements below it.
If your form displays records in a subform, be sure that the subform is set to print with a fixed frame so that the records do not wrap onto additional pages. For information about printing with a fixed frame, see "Subform Printing" in the List subforms section.
Drag the Detail (D), Break (B0), and Footer (F) control lines to the bottom of the page to ensure that only one record is printed per page.
You are probably very familiar with an invoice. A typical invoice shows a name and billing address, a shipping address, a series of items or services purchased, and a total.
An invoicing database includes an output form for printing full-page invoices. For example, an invoice draws information from two tables: an [Orders] table that provides the customer information (bill to and ship to addresses) and a [Line Items] table that provides the line items. The total for the order is calculated and kept in the [Orders] table.
The form for an invoice is created in the [Orders] table and uses a subform area for the line items. The subform area can expand during printing to print all the line items, even if the invoice requires a second page. For more information, see the "Subform Printing" in the List subforms section.
The Detail area is expanded to the full-page size. One invoice is printed for each sales order, but as many line items as necessary are printed in the line items area of the invoice.
Many databases allow the user to enter notes or descriptions in a text field or variable. Similarly, reports can contain photos or graphics displayed in Picture fields or variables.
These elements can be printed as expandable areas in the Detail area. They can be expanded during printing to accommodate all of the data. For more information about configuring this printing mode, see the Print Variable Frame section.
Note: This principle also applies to 4D Write Pro areas.
If you want to create special mailing labels, you can design a custom output form for them. The design can use graphic elements, any available fonts, and variables.
Note: It is sometimes quicker and easier to create mailing labels using the integrated Label editor.
The creation of output forms used for printing mailing labels is detailed in Using the PRINT LABEL command.
4D can print reports that work with Breaks and Break Headers. A Break is created when you sort the records.
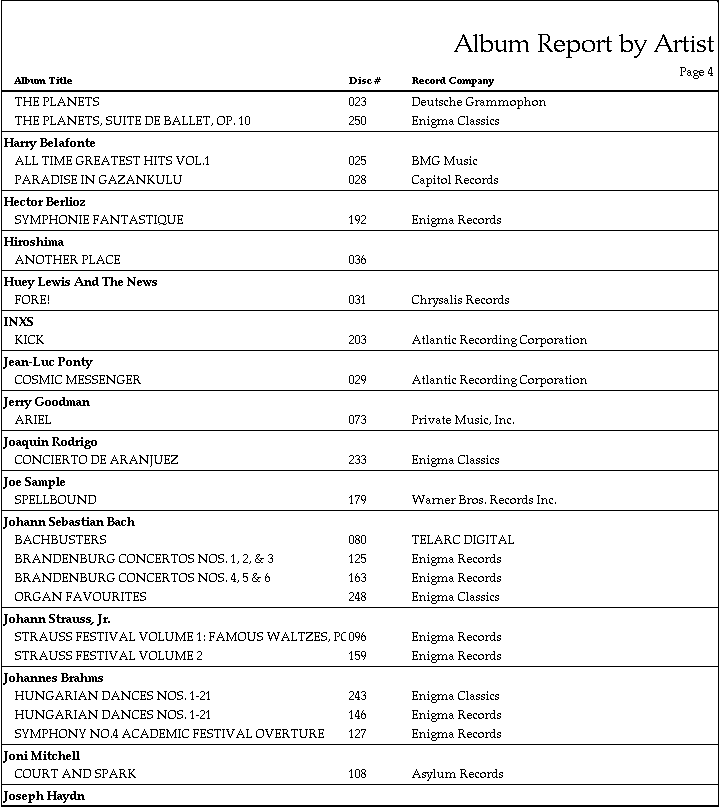
Suppose you have a collection of compact discs that you keep track of in a 4D database and you want to print a list that arranges the information by artist. When you sort the records by artist, all the records fall into distinct groups. The “Break” occurs after the last record in each group is printed. Here is how the report looks when previewed on screen:
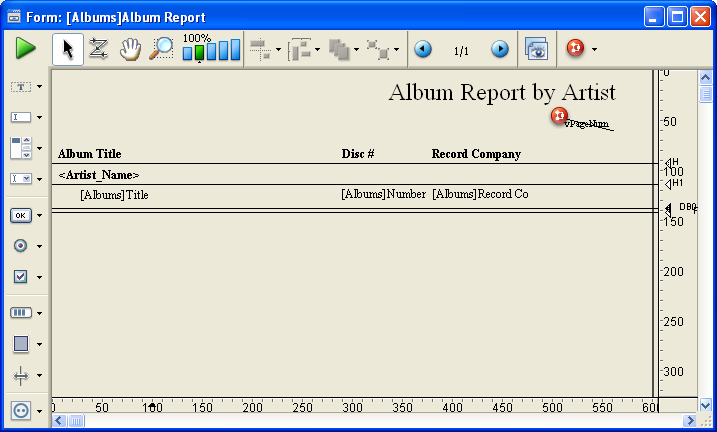
4D provides features that you can use to display the information attractively. Here is this form in the Design environment:
Note: In order to build a report that uses Break levels and Headers, you must first initiate Break processing. For more information about the methods you can use to initiate Break processing, refer to “Initiating break processing” below.
A Break Header is printed once before the group of records it refers to and a Break is printed once after the group of records it refers to. In the illustration on the previous page, the Break is called a “level 1 Break” and the Break Header is called a “level 1 Break Header,” because the Break occurs as a result of the first field sorted.
You can use up to nine break levels. If you use Subtotal to initiate Break processing, you need to sort on one more field than the number of Breaks you use. In this case, if you use one Break level, you must sort on two fields. If you use three Break levels, you must sort on four fields, and so on.
In the report form, additional break levels and break header levels must correspond to additional areas. You create these areas by adding output control lines. To find out how to add output control lines, refer to the "Creating additional control lines" section in Using output control lines.
This section explains how to create reports with breaks. A complete example is found in An example report.
To allow 4D to print Break Header areas, accumulate subtotals, and perform other aspects of Break processing, you must first initiate Break processing in the report form. You initiate Break processing by either:
- Placing the Subtotal function in an object or form method,
- Executing the BREAK LEVEL and ACCUMULATE commands before printing the report.
If you use the Subtotal function, you must also sort the records on one more sort field than the number of Break levels you use. For example, if you use two levels of Breaks in your report, you must sort on three fields.
This section describes in detail how the sort order affects reports and how to use additional Break areas for creating subtotals.
4D can automatically calculate and print totals and subtotals. The figure below shows a report that calculates subtotals for each customer and a total at the end of the report.
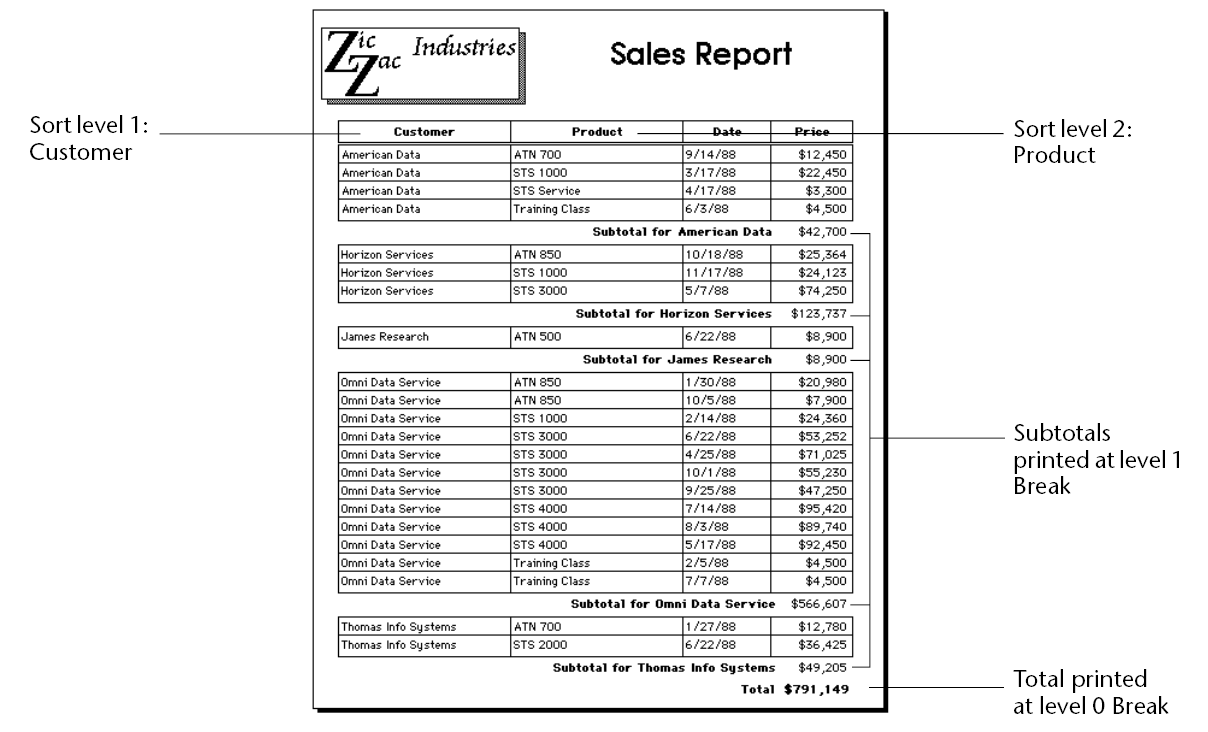
These records have been sorted by customer and product. After the records for each customer have been printed, the subtotal for the customer is calculated and printed. After the records for the entire report have been printed, the total is calculated and printed.
As you can see in the figure above, the subtotals are calculated and printed after the records for each customer.
4D knows when to perform the calculation and print the subtotal because it has been instructed to do so when the value in the first sorted field changes (where it “breaks”). The customer subtotal is calculated in what is called a level 1 Break because it is based on a change in the first sorted level (in this case, the Customer field). The grand total is calculated in a level 0 Break. A level 0 Break includes all the records and occurs at the end of the report.
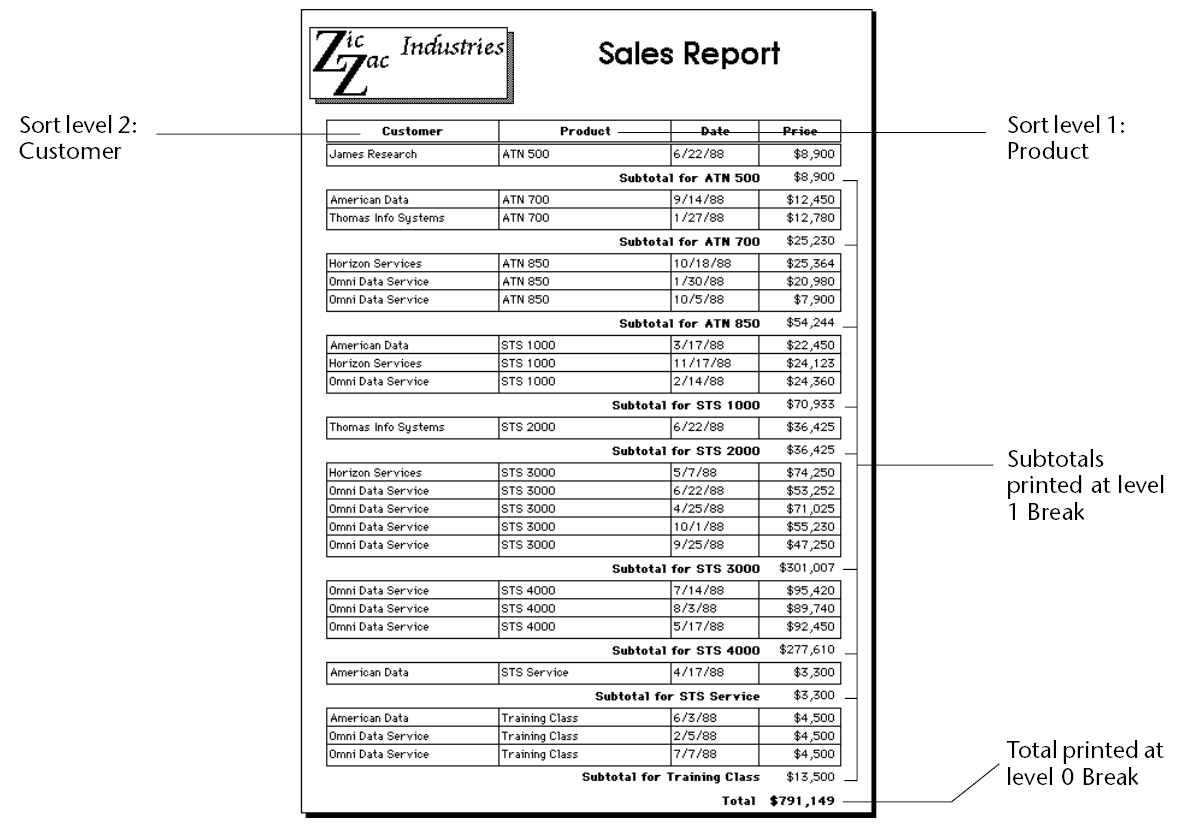
The figure below shows another example of calculations during a Break, using the same records, but with a different sort order to create a different Break. This time the records have been sorted by product and customer. The subtotals are calculated when the value in the Product field changes. This is still a level 1 Break, but the Break is on a different field.
You can provide additional summary calculations by adding another sort level and another Break level.
The following figure shows sales records sorted by customer, product, and salesperson. Summary calculations show two sets of subtotals: one subtotal for each customer, and, within each customer, subtotals for each product for the customer. Finally, this report calculates a total for the entire company. These are examples of calculations performed at level 2 Breaks, at level 1 Breaks, and at the level 0 Break.
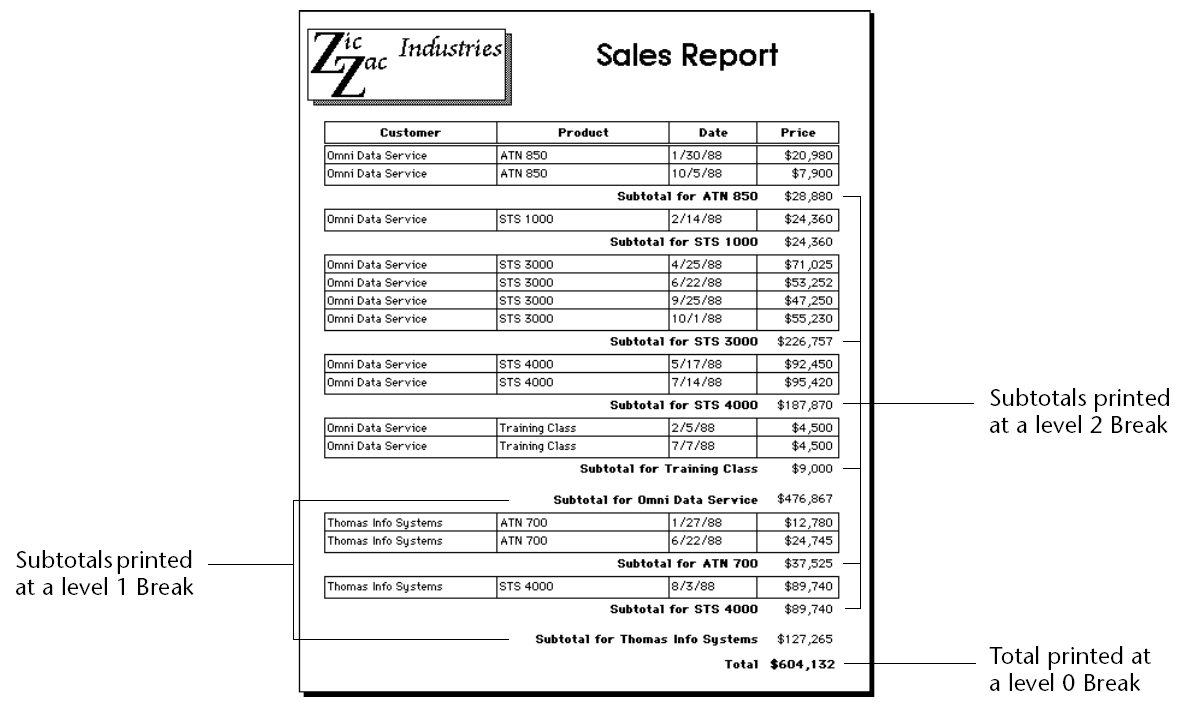
The subtotal calculations are performed only for the group of records that precedes the Break. For example, a subtotal is calculated for each product sold to each customer. The subtotal for the customer is calculated for all products sold to that customer.
Note: For more information about adding break levels, refer to "Creating additional control lines" section in Using output control lines.
You can create a report that prints only summary information. Such a report displays only the subtotals and totals with appropriate additional text. The following illustration shows a report with only summary information:
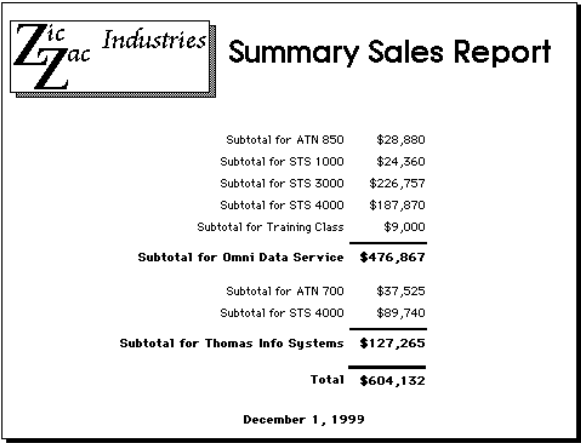
In this report, the records are sorted by customer, product, and date and the calculations are performed during the Breaks created by the sort order. The Detail area for each record is not printed; the records are used only to provide values for the calculations. Notice that 4D goes through the records from the first to the last during the printing of the report so that it can calculate these figures. (You create this kind of report by placing the Detail control line on top of the Header control line, leaving no space for details to print).
You can ask 4D to perform additional calculations on a list including subtotals, averages, maximum and minimum values, page totals to be printed in a footer, and weighted averages. These calculations, and others, use 4D’s summary functions (see On a Series).
Creating mail-merge documents
List boxes
Printing records
Quick reports
Using output control lines

Product: 4D
Theme: Output forms and reports
4D Design Reference ( 4D v16)
4D Design Reference ( 4D v16.1)
4D Design Reference ( 4D v16.3)


