
4D v12.4
GRAPH
 GRAPH
GRAPH
| GRAPH ( graphArea ; graphNumber ; xLabels {; yElements} {; yElements2 ; ... ; yElementsN} ) | ||||||||
| Parameter | Type | Description | ||||||
| graphArea | Graph variable, Picture variable |

|
Graph area or Picture variable | |||||
| graphNumber | Longint |
|
Graph type number | |||||
| xLabels | Array |
|
Labels for the x-axis | |||||
| yElements | Array |
|
Data to graph (up to eight allowed) | |||||
GRAPH draws a graph for a Graph area or a picture variable located in a form on the basis of values coming from arrays. The GRAPH command must be placed in the form method or in an object method belonging to the form, or yet again in a project method called by one of these two methods.
The graphs generated by this command can be drawn either using the integrated 4D Chart plug-in, or, beginning with 4D version 11, via the integrated SVG rendering engine.
Note: SVG (Scalable Vector Graphics) is a graphics file format (.svg extension). Based on XML, this format is widespread and can be displayed more particularly in Web browsers. For more information, please refer to the following address: http://www.w3.org.Graphics/SVG/. The SVG EXPORT TO PICTURE command can also be used to take advantage of the integrated SVG engine.
The type of the graphArea parameter determines which graphics engine is used for rendering: if you pass a 4D Chart area reference or a graph area variable, the 4D Chart plug-in will be used. If you pass a picture varaible, the SVG engine will be used. You can choose the type of engine to be used according to the following criteria:
- Graphs generated by 4D Chart can be entirely controlled, handled and enhanced by programming using the commands of the 4D Chart plug-in. For more information about 4D Chart commands, please refer to the manual 4D Chart Language.
- Graphs generated by the SVG engine have a more modern appearance and benefit from interface functions associated with picture variables: context menu in Application mode (which can be used more particularly to choose the display format), scrollbars, etc.
In the graphArea parameter, pass either the graph area name (or a 4D Chart area reference), or a 4D picture variable, according to the rendering engine to be used. These areas are created in the Form editor in Design mode. For more information, see the 4D Design Reference manual.
The graphNum parameter defines the type of graph that will be drawn. It must be a number from 1 to 8. The graph types are described in Example 1. After a graph has been drawn, you can change the type by changing graphNum and executing the GRAPH command again.
The xLabels parameter defines the labels that will be used to label the x-axis (the bottom of the graph). This data can be of string, date, time, or numeric type. There should be the same number of array elements in xLabels as there are subrecords or array elements in each of the yElements.
The data specified by yElements is the data to graph. The data must be numeric. Up to eight data sets can be graphed. Pie charts graph only the first yElements.
The following example shows the different types of graphs that you can obtain with each graphics engine.. The code would be inserted in a form method or object method. It is not intended to be realistic, since the data is constant:
C_PICTURE(vGraph) `Pass if you want to use the SVG engine
ARRAY STRING(4;X;2) ` Create an array for the x-axis
X{1}:="1995" ` X Label #1
X{2}:="1996" ` X Label #2
ARRAY REAL(A;2) ` Create an array for the y-axis
A{1}:=30 ` Insert some data
A{2}:=40
ARRAY REAL(B;2) ` Create an array for the y-axis
B{1}:=50 ` Insert some data
B{2}:=80
vType:=1 ` Initialize graph type
GRAPH(vGraph;vType;X;A;B) ` Draw the graph
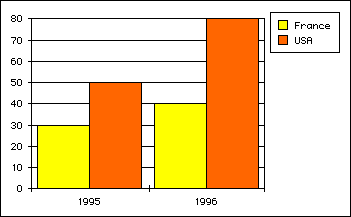
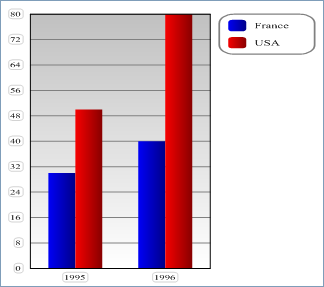
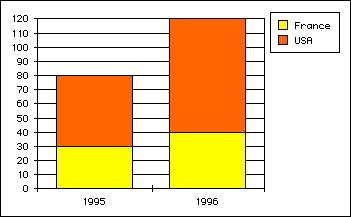
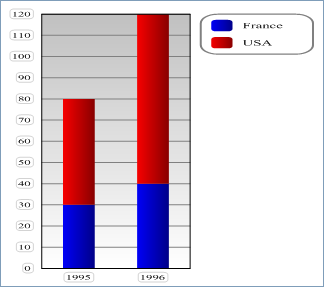
GRAPH SETTINGS(vGraph;0;0;0;0;False;False;True;"France";"USA") ` Set the legends for the graphThe following figures show the resulting graph with each rendering engine (4D Chart then SVG).
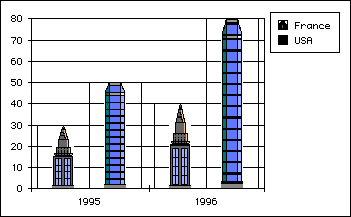
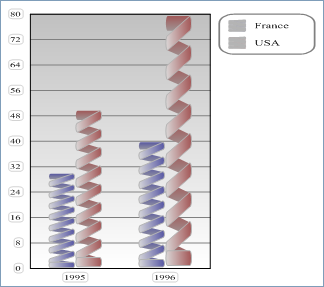
- With vType equal to 1, you obtain a Column graph:
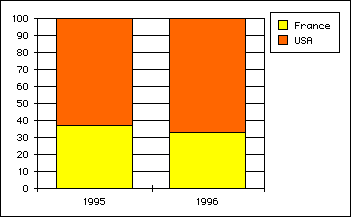
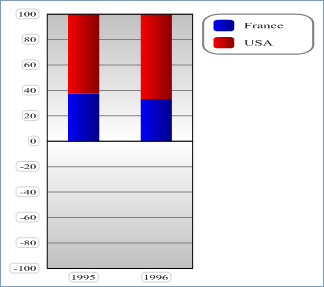
- With vType equal to 2, you obtain a Proportional Column graph:
- With vType equal to 3, you obtain a Stacked Column graph:
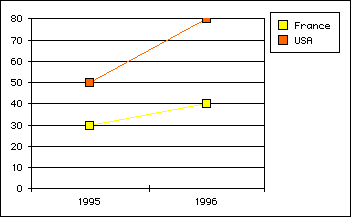
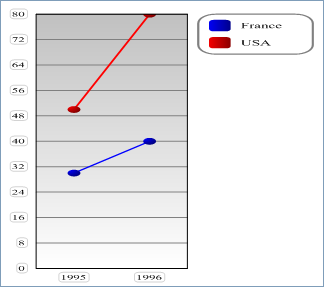
- With vType equal to 4, you obtain a Line graph:
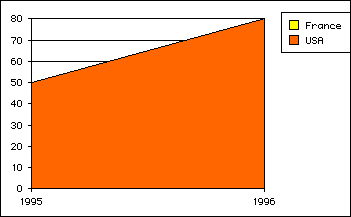
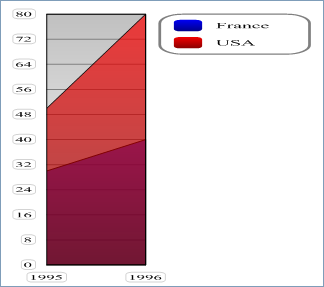
- With vType equal to 5, you obtain a Area graph:
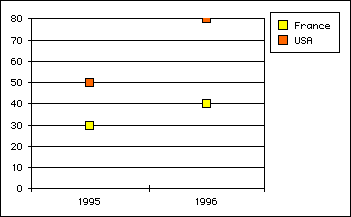
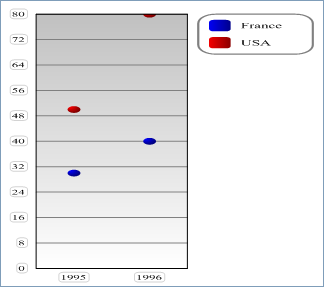
- With vType equal to 6, you obtain a Scatter graph:
- With vType equal to 7, you obtain a Pie graph:
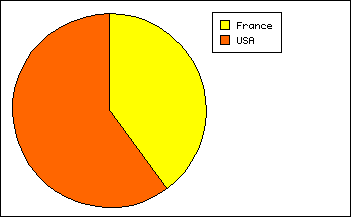
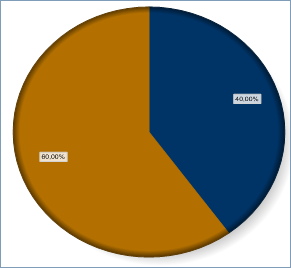
- With vType equal to 8, you obtain a Picture graph:
Product: 4D
Theme: Graphs
Number:
169
Modified: 4D v11 SQL
GRAPH SETTINGS
GRAPH TABLE
SVG EXPORT TO PICTURE


