4D v14
Maintenance Page
 Maintenance Page
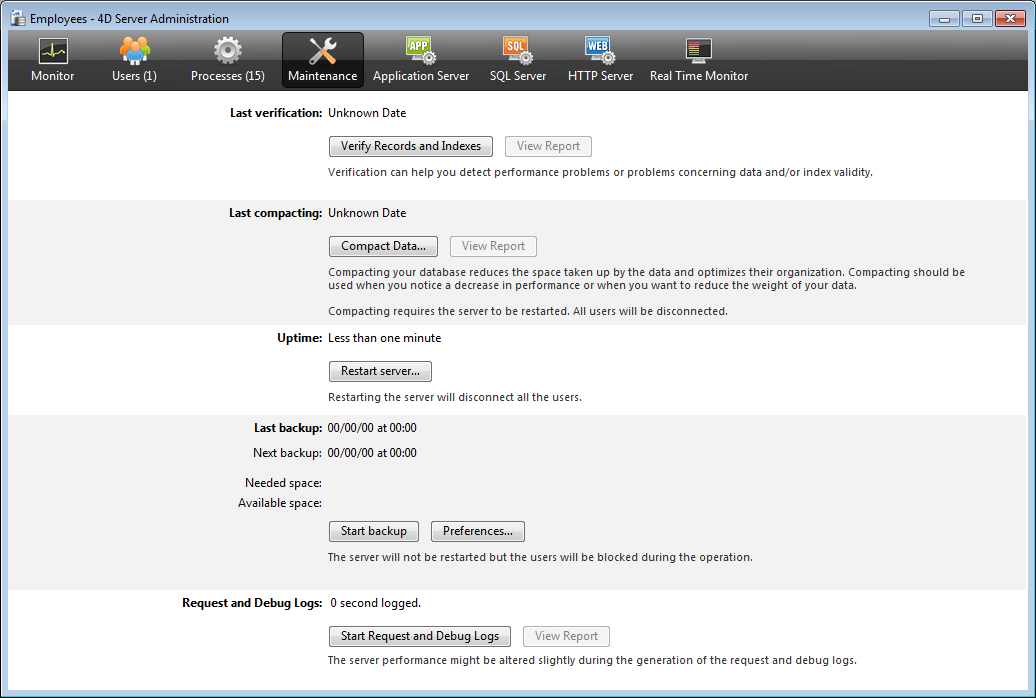
The Maintenance Page provides information concerning the current operation of the database. It also provides access to basic maintenance functions:

- Last verification: This area indicates the date, time and status of the last data verification carried out on the database. For more information about the data verification procedure, please refer to the Design Reference manual.
The Verify Records and Indexes button can be used to launch the verification operation directly, without interrupting the server. Note that the server may be noticeably slowed down during the operation.
All the records and all the indexes of the database are verified. If you want to be able to target the verification or have additional options available, you will need to use the Maintenance and Security Center (MSC).
After verification, a report file is generated in XML and HTML format on the server in the Logs folder that is placed next to the database structure file. The View Report button (named Download report if the operation was carried out from a client machine) lets you display the file in your browser. - Last compacting: This area indicates the date, time and status of the last compacting operation carried out on the database data. For more information about the data compacting procedure, please refer to the Design Reference manual.
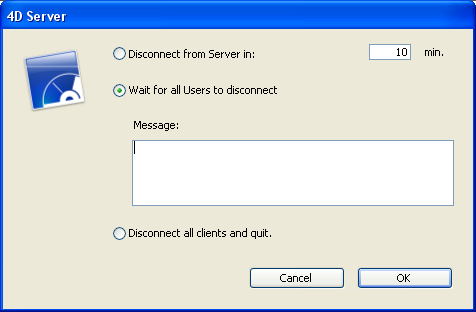
The Compact Data... button can be used to launch a data compacting operation directly. This operation requires stopping the server: when you click on this button, the 4D Server database shutdown dialog box appears so that you can choose how to interrupt the operation:

For more information about this dialog box, please refer to the Exiting 4D Server section.
After the actual interruption of the database, 4D Server carries out a standard compacting operation on the database data. If you want to have additional options available, you will need to use the Maintenance and Security Center (MSC).
Once the compacting is finished, 4D Server automatically restarts the database. The 4D users can then be reconnected.
Note: If the request for compacting was carried out from a remote 4D client machine, this machine is automatically reconnected by 4D Server.
A report file is generated in XML and HTML formats on the server in the Logs folder that is placed next to the database structure file. The View Report button (named Download report if the operation was carried out from a client machine) lets you display the file in your browser.
- Uptime: This area indicates the duration of the server operation since the last time it was started (days, hours and minutes).
The Restart server... button can be used to immediately restart the server. When you click on this button, the 4D Server database shutdown dialog box appears so that you can choose how to interrupt the operation (see the Exiting 4D Server section). After restarting, 4D Server automatically relaunches the database. The 4D users can then be reconnected.
Note: If the request for restarting was carried out from a remote 4D client machine, this machine is automatically reconnected by 4D Server. - Last backup: This area indicates the date and time of the last backup of the database and provides information about the next scheduled automatic backup (if any). Automatic backups are configured using the "Scheduler" page of the database Preferences.
- Next backup: date and time of next automatic backup.
- Needed space: estimated space needed for the backup. The actual size of the backup file may vary according to the settings (compression, etc.) and according to variations of the data file.
- Available space: space available on the backup volume.
The Start backup button can be used to backup the database immediately using the current backup parameters (files backed up, location of archives, options, etc.). You can view these parameters by clicking on the Preferences... button. During a backup on the server, the client machines are "blocked" (but not disconnected) and it is not possible for any new clients to connect. - Request and Debug logs: This area indicates the duration of recording log requests and debugging events, when they are activated.
- The request log file stores information concerning the requests received by the server (excluding Web requests): time, process number, user, request size, processing time, etc. that can be used to analyze the server operation. This file is named 4DRequestsLog_X (X being the sequential number of the file) and is stored in the Logs folder of the database. Once the file reaches the size of 10 MB, it is closed and a new file is generated, with an incremented sequential number.
- The debugging events file stores each execution of a method, 4D command or plug-in command in a file named “4DDebugLog.txt,” which is automatically placed in the Logs subfolder of the database, next to the structure file. Each event is systematically recorded in the file before its execution, which ensures its presence in the file even if the application quits unexpectedly. Note that this file is erased and rewritten each time you launch the application. You can configure this file using the SET DATABASE PARAMETER command.
The Start Request and Debug Logs button starts the requests log and records the debugging events. Since this may noticeably deteriorate server performance, it is to be reserved for the development phase of the application.
Once the request log has been activated, the button title changes to Stop Request and Debug Logs, so that you can stop recording requests at any time. Keep in mind that restarting the log after stopping it "erases" the previous file.
Note: It is possible to start and stop these logs by programming via the SET DATABASE PARAMETER command.
The View Report button (named Download report if the operation was carried out from a client machine) lets you open a system window displaying the request log file.
Product: 4D
Theme: 4D Server Administration Window
4D Server Reference ( 4D v14 R2)
4D Server Reference ( 4D v14)
4D Server Reference ( 4D v14 R3)
4D Server Reference ( 4D Server v14 R4)
Inherited from : Maintenance Page ( 4D v13)


