
4D v16.3
Source Code Pane
 Source Code Pane
The Source Code Pane shows the source code of the method being traced.
If the method is too long to fit in the text area, you can scroll to view other parts of the method.
Moving the mouse pointer over any expression that can be evaluated (field, variable, pointer, array,...) will cause a Tool Tip to display the current value of the object or expression and its declared type.
Here is an example of the Source Code Pane:
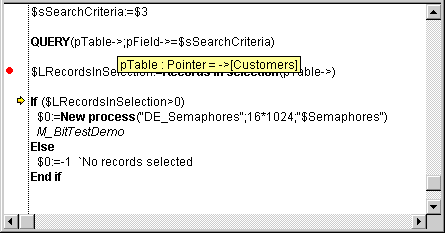
A tool tip is displayed because the mouse pointer was over the variable pTable which, according to the tool tip, is a pointer to the table [Customers].
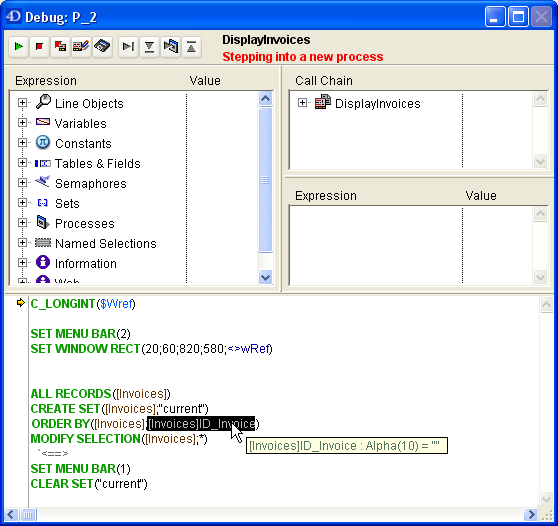
You can also select a portion of the text in the area displaying the code being executed. In this case, when the cursor is placed above the selected text, a tip displays the selected object’s value:
When you click on a variable name or field, it is automatically selected.
Tip: It is possible to copy any selected expression (that can be evaluated) from the Source Code Pane to the Custom Watch Pane. You can use one of the following ways:
- by simply dragging and dropping (click on the selected text, drag it and drop it in the evaluation area).
- by using the Ctrl+D (Windows) or Command+D (Mac OS) key combinations.
A yellow arrow in the left margin of the Source Code pane (see the figure above) marks the next line that will be executed. This arrow is called the program counter. The program counter always indicates the line that is about to be executed.
For debugging purposes, you can change the program counter for the method being on top of the call chain (the method actually being executed). To do so, click and drag the yellow arrow vertically, to the line you want.
WARNING: Use this feature with caution!
Moving the program counter forward does NOT mean that the debugger is rapidly executing the lines you skip. Similarly, moving the program counter backward does NOT mean that the debugger is reversing the effect of the lines that has already been executed.
Moving the program counter simply tells the debugger to “pursue tracing or executing from here.” All current settings, fields, variables, and so on are not affected by the move.
Here is an example of moving the program counter. Let’s say you are debugging the following code:
  ` ...

 If(This condition)

    DO SOMETHING

 Else

    DO SOMETHING ELSE

 End if

  ` ...
The program counter is set to the line If (This condition). You step once and you see that the program counter moves to the line DO SOMETHING ELSE. This is unfortunate, because you wanted to execute the other alternative of the branch. In this case, and provided that the expression This condition does not perform operations affecting the next steps in your testing, just move the program counter back to the line DO SOMETHING. You can now continuing tracing the part of the code in which you are interested.
In the debugging process, you may need to skip the tracing of some parts of the code. The debugger offers you several ways to execute code up to a certain point:
- While stepping, you can click on the Step Over button instead of Step Into button. This is useful when you do not want to enter into possible subroutines or functions called in the program counter line.
- If you mistakenly entered into a subroutine, you can execute it and directly go back to the caller method by clicking on the Step Out button.
- If you have a TRACE call placed at some point, you can click the No Trace button, which resumes the execution up to that call.
Now, let’s say you are executing the following code, with the program counter set to the line ALL RECORDS([ThisTable]):
  ` ...

 ALL RECORDS([ThisTable])

 $vrResult:=0

 For($vlRecord;1;Records in selection([ThisTable]))

    $vrResult:=This Function([ThisTable]))

    NEXT RECORD([ThisTable])

 End for

 If($vrResult>=$vrLimitValue)

  ` ...
Your goal is to evaluate the value of $vrResult after the For loop has been completed. Since it takes quite some execution time to reach this point in your code, you do not want to abort the current execution, then edit the method in order to insert a TRACE call before the line If ($vrResult....
One solution is to step through the loop, however, if the table [ThisTable] contains several hundreds records, you are going to spend the entire day for this operation. In this type of situation, the debugger offers you break points. You can insert break points by clicking in the left margin of the Source Code pane.
For example:
You click in the left margin of the Source Code pane at the level of the line If ($vrResult...:
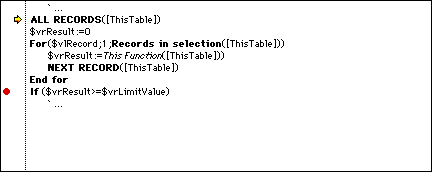
This inserts a break point for the line. The break point is indicated by a red bullet. Then click the No Trace button.
This resumes the normal execution up to the line marked with the break point. That line is not executed itself—you are back to the trace mode. In this example, the whole loop has consequently been executed normally. Then, when reaching the break point, you just need to move the mouse button over $vrResult to evaluate its value at the exit point of the loop.
Setting a break point beyond the program counter and clicking the No Trace button allows you to skip portions of the method being traced.
Note: You can also set break points directly in 4D's Method Editor. Please refer to the section Break Points.
Once you add a break point, it remains associated with the method. Even if you quit the database and then reopen it later on, the break point is still there.
There are two ways to eliminate a persistent break point:
- If you are through with it, just remove it by clicking on the red bullet—the break point disappears.
- If you are not totally through with it, you may want to keep the break point. You can temporarily disable the break point by editing it. This explained in the section Break Points.
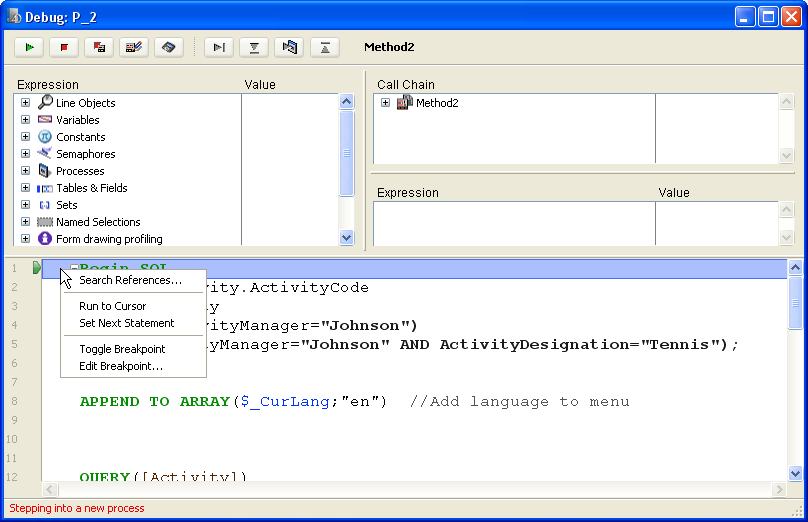
The context menu of the Source Code Pane provides access to several functions that are useful when executing methods in Trace mode:
- Goto Definition: Goes to where the selected object is defined. This command is available for the following objects:
- Project methods: displays method contents in a new window of the Method editor..
- Fields: Displays field properties in the inspector of the Structure window,
- Tables: Displays table properties in the inspector of the Structure window,
- Forms: Displays form in the Form editor,
- Variables (local, process, interprocess or $n parameter):displays the line in the current method or among the compiler methods where the variable is declared.
- Search References (also available in Method editor): Searches all database objects (methods and forms) in which the current element of the method is referenced. The current element is the one selected or the one where the cursor is located. This can be the name of a field, variable, command, string, and so on. Search results are displayed in a new standard results window.
- Run to Cursor:Executes statements found between the program counter (yellow arrow) and the selected line of the method (where the cursor is found).
- Set Next Statement:Moves program counter to the selected line without executing this line or any intermediate ones. The designated line is only run if the user clicks on one of the execution buttons.
- Toggle Breakpoint (also available in Method editor): Alternately inserts or removes the breakpoint corresponding to the selected line. This modifies the breakpoint permanently: for instance, if you remove a breakpoint in the debugger, it no longer appears in the original method.
- Edit Breakpoint (also available in Method editor):Displays the Breakpoint Properties dialog box. Any changes made modify the breakpoint permanently .
Break Points
Call Chain Pane
Custom Watch Pane
Debugger
Watch Pane

Product: 4D
Theme: Debugging
debugger source code pane
4D Language Reference ( 4D v16)
4D Language Reference ( 4D v16.1)
4D Language Reference ( 4D v16.2)
4D Language Reference ( 4D v16.3)


