
4D v14.3
GRAPH
 GRAPH
GRAPH
| GRAPH ( graphPicture ; graphNumber ; xLabels {; yElements} {; yElements2 ; ... ; yElementsN} ) | ||||||||
| Parameter | Type | Description | ||||||
| graphPicture | Picture variable |

|
Picture variable | |||||
| graphNumber | Longint |
|
Graph type number | |||||
| xLabels | Array |
|
Labels for the x-axis | |||||
| yElements | Array |
|
Data to graph (up to eight allowed) | |||||
Compatibility note: Beginning with 4D v14, the GRAPH command only works with a picture variable as its first parameter. The obsolete syntax using a graph area (4D Chart) is no longer supported.
GRAPH draws a graph for a picture variable located in a form on the basis of values coming from arrays. The GRAPH command must be placed in the form method or in an object method belonging to the form, or yet again in a project method called by one of these two methods.
The graphs generated by this command are drawn using the integrated SVG rendering engine. They have interface functions associated with picture variables: a context menu in Application mode (to let you choose, more particularly, the display format), scrollbars, and so on. Specific IDs are assigned automatically to elements present in the graph generated, that you can use to handle them individually (see the following paragraph).
Note: SVG (Scalable Vector Graphics) is a graphics file format (.svg extension). Based on XML, this format is widespread and can be displayed more particularly in Web browsers. For more information, please refer to the following address: http://www.w3.org.Graphics/SVG/. The SVG EXPORT TO PICTURE command can also be used to take advantage of the integrated SVG engine.
In the graphPicture parameter, pass the name of the picture variable that displays the graph in the form.
The graphNum parameter defines the type of graph that will be drawn. It must be a number from 1 to 8. The graph types are described in Example 1. After a graph has been drawn, you can change the type by changing graphNum and executing the GRAPH command again.
The xLabels parameter defines the labels that will be used to label the x-axis (the bottom of the graph). This data can be of string, date, time, or numeric type. There should be the same number of array elements in xLabels as there are subrecords or array elements in each of the yElements.
The data specified by yElements is the data to graph. The data must be numeric. Up to eight data sets can be graphed. Pie charts graph only the first yElements.
Specific IDs are now assigned automatically to elements found in the SVG graph:
| IDs | Description |
| ID_graph_1 to ID_graph_8 | Columns, lines, areas... |
| ID_graph_shadow_1 to ID_graph_shadow_8 | Shadows for columns, lines, areas... |
| ID_bullet_1 to ID_bullet_8 | Points (Line and Scatter graphs only) |
| ID_pie_label_1 to ID_pie_label_8 | Pie chart labels (Pie chart graphs only) |
| ID_legend_1 to ID_legend_8 | Legend titles |
| ID_legend_border | Legend borders |
| ID_legend_border_shadow | Shadows for legend borders |
| ID_x_values | Values of X axis |
| ID_y_values | Values of Y axis |
| ID_y0_axis | Values of Z axis |
| ID_background | Background |
| ID_background_shadow | Background shadow |
| ID_x_grid | Grid on X axis |
| ID_x_grid_shadow | Shadow for grid on X axis |
| ID_y_grid | Grid on Y axis |
| ID_y_grid_shadow | Shadow for grid on Y axis |
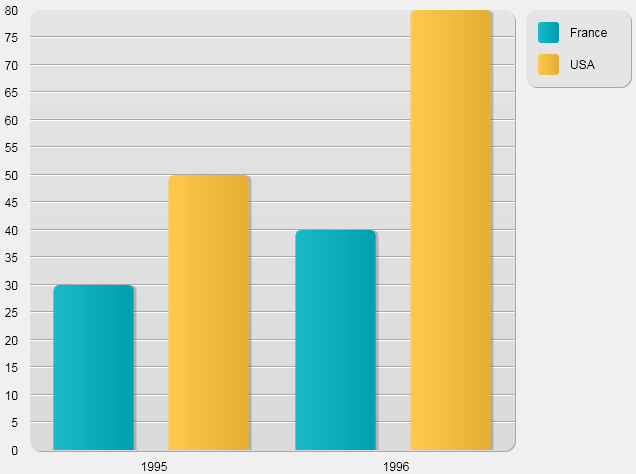
The following example shows the different types of graphs that you can obtain. The code would be inserted in a form method or object method. It is not intended to be realistic, since the data is constant:
 C_PICTURE(vGraph) //Variable of graph

 ARRAY TEXT(X;2) //Create an array for the x-axis

 X{1}:="1995" //X Label #1

 X{2}:="1996" //X Label #2

 ARRAY REAL(A;2) //Create an array for the y-axis

 A{1}:=30 //Insert some data

 A{2}:=40

 ARRAY REAL(B;2) //Create an array for the y-axis

 B{1}:=50 //Insert some data

 B{2}:=80

 vType:=1 //Initialize graph type

 GRAPH(vGraph;vType;X;A;B) //Draw the graph

 GRAPH SETTINGS(vGraph;0;0;0;0;False;False;True;"France";"USA") //Set the legends for the graph
The following figures show the resulting graph.
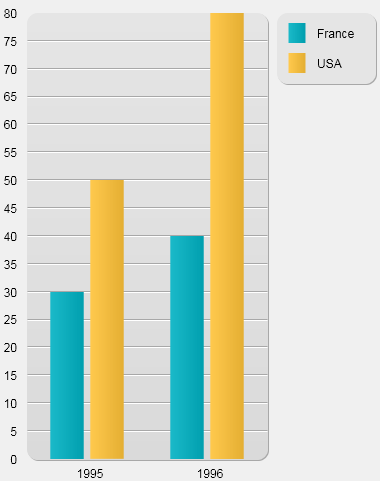
- With vType equal to 1, you obtain a Column graph:
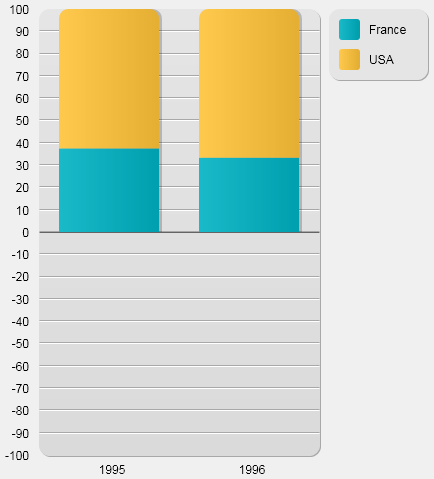
- With vType equal to 2, you obtain a Proportional Column graph:
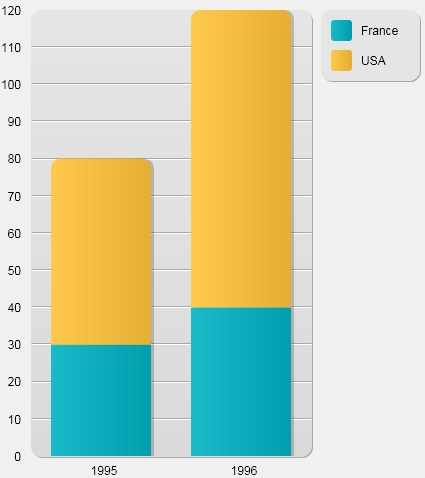
- With vType equal to 3, you obtain a Stacked Column graph:
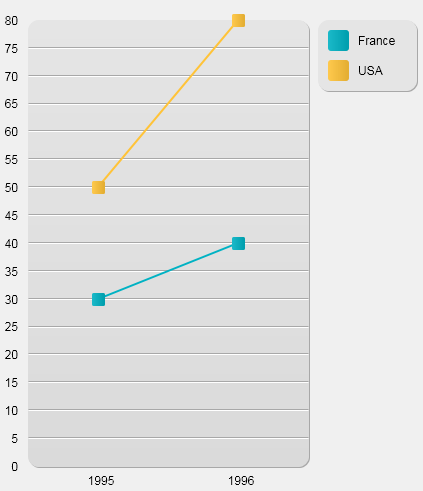
- With vType equal to 4, you obtain a Line graph:
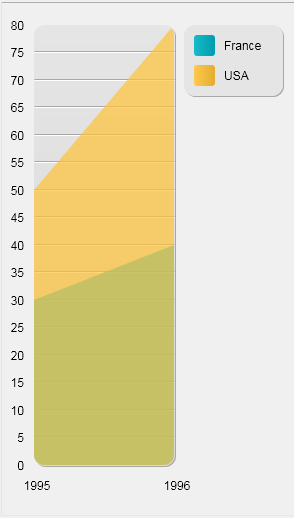
- With vType equal to 5, you obtain a Area graph:
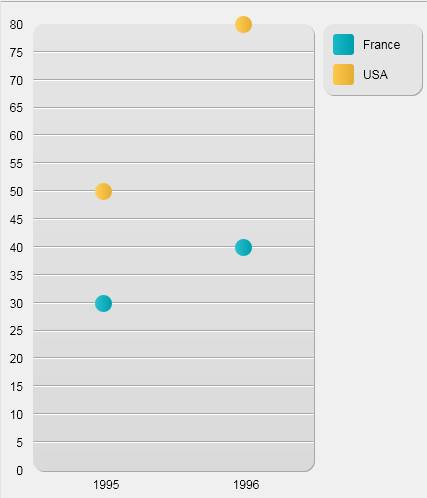
- With vType equal to 6, you obtain a Scatter graph:
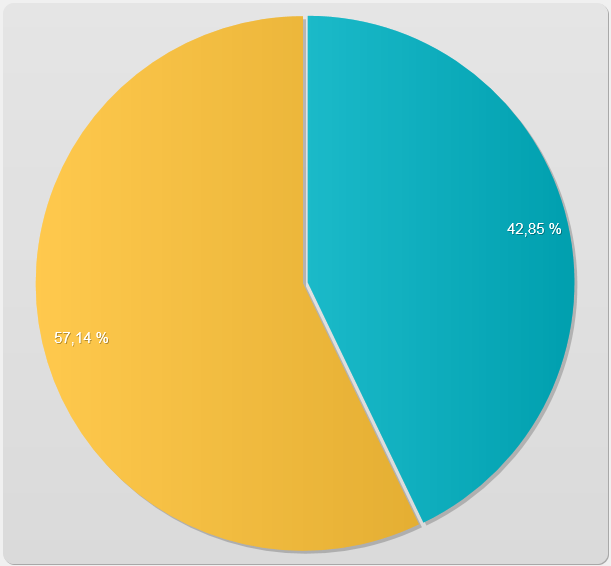
- With vType equal to 7, you obtain a Pie graph:
- With vType equal to 8, you obtain a Picture graph:
Note: Pictures are simple rectangles by default.
Product: 4D
Theme: Graphs
Number:
169

Modified: 4D v11 SQL
Modified: 4D v13
Modified: 4D v14
_o_GRAPH TABLE
GRAPH SETTINGS
SVG EXPORT TO PICTURE
4D Language Reference ( 4D v14 R3)
4D Language Reference ( 4D v14 R2)
4D Language Reference ( 4D v14.3)
4D Language Reference ( 4D v14 R4)
Inherited from : GRAPH ( 4D v13.5)


