
4D Chart v13
Parameter Codes
- 4D Chart
-
- Control Codes
-
- Command Codes
- 4D Chart Error Codes
- Parameter Codes
4D Chart v13
Parameter Codes
 Parameter Codes
This section contains the codes for frequently used parameters of 4D Chart. These parameters are:
- partType
- partSpecifics
- pattern
- options
When you modify parts of a graph programmatically, such as the legend or one of the axes, you specify which part of the graph to modify using the partType and partSpecifics parameters.
Some of the major parts of a graph are labelled in the following illustration:
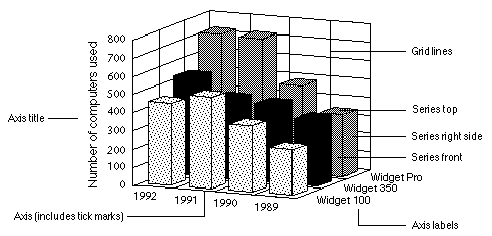
- The following are the codes for the partType parameter:
Code Graph Part 1 Plot rectangle 2 Legend 3 Axis 4 Label 5 Title 6 Major gridlines 7 Minor gridlines 8 Series 9 Value labels for series
- The following are the codes for the partSpecifics parameter:
Graph Part Specific Part Code Plot rectangle For 2D graphs: 0 = Entire rectangle, For 3D graphs: 1 = Back, 2 = Side, 3 = Bottom Legend 0 = Legend rectangle Axis 0 = Category, 1 = Series, 2 = Values Labels 0 = Category, 1 = Series, 2 = Values Titles 0 = Category, 1 = Series, 2 = Values Major gridlines 0 = Category, 1 = Series, 2 = Values Minor gridlines 0 = Category, 1 = Series, 2 = Values Series/Value labels (Series number * 100) + (Side number) for series Side numbers (for sides of series) 0 = All sides (also use for all 2D graphs),1 = Front, 2 = Left, 3 = Right, 4 = Top, 5 = Bottom
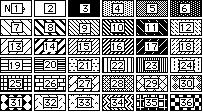
Following are the codes for the pattern parameter:
Following are the codes for the options parameter used in the CT GET CHART OPTIONS and CT SET CHART OPTIONS commands:
| Graph Type | Element Number | Codes |
| Area | 1 | Orientation: 0 = Vertical, 1 = Horizontal |
| 2 | Stacked: 0 = Normal, 1 = Stacked, 2 = Stacked Proportional | |
| Column | 1 | Orientation: 0 = Vertical, 1 = Horizontal |
| 2 | Stacked: 0 = Normal, 1 = Stacked, 2 = Stacked Proportional | |
| 3 | Overlap percent (0 through 100) | |
| 4 | Gap percent (0 through 100) | |
| Line | 1 | Orientation: 0 = Vertical, 1 = Horizontal |
| 2 | Stacked: 0 = Normal, 1 = Stacked, 2 = Stacked Proportional | |
| 3 | Controls display of squares on a 2D line: 0 = Invisible, 1 = Visible | |
| Scatter | 1 | Orientation: 0 = Vertical, 1 = Horizontal |
| 2 | Stacked: 0 = Normal, 1 = Stacked, 2 = Stacked Proportional | |
| Pie | 1 | Start angle (0 through 360) |
| Picture | 1 | Orientation: 0 = Vertical, 1 = Horizontal |
| 2 | Stacked: 0 = Normal, 1 = Stacked, 2 = Stacked Proportional | |
| 3 | Overlap percent (0 through 100) | |
| 4 | Gap percent (0 through 100) | |
| 5 | Horizontal alignment: 0 = Left, 1 = Center, 2 = Right | |
| 6 | Vertical alignment: 0 = Top, 1 = Center, 2 = Bottom | |
| 7 | Horizontal display: 0 = Clipped, 1 = Stretched, 2 = Stacked | |
| 8 | Vertical display: 0 = Clipped, 1 = Stretched, 2 = Stacked | |
| Polar | None | |
| XY Chart | 1 | Form of point: 0 = No point display, 1 = Circles, 2 = Squares, 3 = Stars |
| 2 | Type of line: 0 = No lines, 1 = Straight lines, 2 = Arrow lines | |
| 3 | Display regression line: 0 = No, 1 = Yes | |
| 3D Column | 1 | Specify category percent as percent of: 0 = Width, 1 = Gap |
| 2 | Specify series percent as percent of: 0 = Width, 1 = Gap | |
| 3 | Category percent (0 through 100) | |
| 4 | Series percent (0 through 100) | |
| 5 | Visible sides: 0 = All, 1 = Tops only | |
| 3D Line | 1 | Specify series percent as percent of: 0 = Width, 1 = Gap |
| 2 | Series percent (0 through 100) | |
| 3D Area | 1 | Specify series percent as percent of: 0 = Width, 1 = Gap |
| 2 | Series percent (0 through 100) | |
| 3D Surface | 1 | Visible sides: 0 = All, 1 = Tops only |
| 3D Triangle | 1 | Flipped: 0 = False, 1 = True |
| 2 | Plot zero values: 0 = False, 1 = True | |
| 3 | Specify series percent as percent of: 0 = Width, 1 = Gap | |
| 4 | Series percent (0 through 100) | |
| 3D Spike | 1 | Spike head: 0 = Oval, 1 = Square |
PROPERTIES
Product: 4D Chart
Theme: Control Codes


© 1985-2013 4D SAS / 4D, Inc. All rights reserved.